基于filebeat实现日志采集
filebeat 概述
- filebeat 基于 golang语言开发 所以无需配置Java环境以及JDK等,性能非常出色,并且占用空间也非常小
- 但是相对logstash过滤的条件较少,只适合一些对数据收集格式要求不高的场景
- 可以通过将filebeat收集的数据转交给logstash来进行处理,以达到需要的格式等需求
- 还可以将输出转发给redis、kafka等应用进行下一步处理
filebeat 安装
- 国内镜像下载地址:https://mirrors.tuna.tsinghua.edu.cn/elasticstack/yum/elastic-7.x/7.16.3/filebeat-7.16.3-x86_64.rpm
#直接安装即可
rpm -iv filebeat-7.16.3-x86_64.rpm
filebeat 核心配置说明
- 官方文档:https://www.elastic.co/guide/en/beats/filebeat/index.html
- filebeat的配置文件为YAML格式,此格式对缩进非常严格,配置的时候要格外注意
inputs 配置
-
定义输入的文件
-
官方文档:https://www.elastic.co/guide/en/beats/filebeat/7.16/configuration-filebeat-options.html
# /etc/filebeat/filebeat.yml

# ============================== Filebeat inputs ===============================
filebeat.inputs:
- type: log #输入的类型,只能使用官方指定的类型,不能自定义,如:log、redis、tcp等,详情参阅官方文档的 input types
  enabled: true #是否启用,false不启用,true启用
  paths:
    - /var/log/messages #指定输入的文件
    #- /var/log/boot.log #可以指定多个文件
    #- /var/log/*.log #匹配/var/log/下的所有以.log结尾的文件
  #exclude_lines: ['^DBG'] #排除输入文件中的以 DBG开头的行
  #include_lines: ['^ERR', '^WARN'] #不排除输入文件中的以 ERR WARN开头的行
  #prospector.scanner.exclude_files: ['.gz$'] #排除以.gz结尾的文件
  fields: #定义用于后续过滤的字段
    type: system_log #添加过滤信息,此处type可以按需指定,如:app_id: query_engine_12
Outputs 配置
output.elasticsearch
- 输出到 Elasticsearch
# /etc/filebeat/filebeat.yml

output.elasticsearch:
  hosts: ["10.0.0.123:9200"] #es地址和端口,通常都是直接指向负载均衡
  #protocol: "https" #指定协议类型,不指定则默认为http
output.logstash
- 输出到 Logstash
# /etc/filebeat/filebeat.yml

#output.logstash:
  # The Logstash hosts
  #hosts: ["localhost:5044"]

  # Optional SSL. By default is off.
  # List of root certificates for HTTPS server verifications
  #ssl.certificate_authorities: ["/etc/pki/root/ca.pem"]

  # Certificate for SSL client authentication
  #ssl.certificate: "/etc/pki/client/cert.pem"

  # Client Certificate Key
  #ssl.key: "/etc/pki/client/cert.key"
output.file
-
输出到文件,通常用于测试
-
官方文档:https://www.elastic.co/guide/en/beats/filebeat/7.16/file-output.html
# /etc/filebeat/filebeat.yml

output.file:
  path: "/tmp/" #输出的文件路径
  filename: filebeat #输出的文件名
  #rotate_every_kb: 10000 #每个文件的最大大小,达到此限制,文件则会从头写入
  #number_of_files: 7 #保存的最大文件数,达到此限制将删除最初的旧文件
  #permissions: 0600 #文件的权限
filebeat 测试
filebeat配置
[root@nginx-node1 ~]# vim /etc/filebeat/filebeat.yml
# ============================== Filebeat inputs ===============================

filebeat.inputs:
- type: log
  enabled: true
  paths:
    - /apps/nginx/logs/access.log
    - /apps/nginx/logs/error.log
...
# ================================== Outputs ===================================
output.file: #输出到文件进行测试
  path: "/tmp/"
  filename: filebeat.txt
...
重启服务使其生效
[root@nginx-node1 ~]# systemctl restart filebeat.service测试
- 需要生成一些日志才能在索引中出现
访问一个不存在到的页面
# curl 10.0.0.48/AAABBB
<html>
<head><title>404 Not Found</title></head>
<body>
<center><h1>404 Not Found</h1></center>
<hr><center>nginx/1.18.0</center>
</body>
</html>
查看输出结果
[root@nginx-node1 ~]# tail -f /tmp/filebeat.txt
{"@timestamp":"2022-03-19T13:19:33.418Z","@metadata":{"beat":"filebeat","type":"_doc","version":"7.16.3"},"ecs":{"version":"1.12.0"},"log":{"offset":14311,"file":{"path":"/apps/nginx/logs/access.log"}},"message":"{\"@timestamp\": \"19/Mar/2022:21:19:29 +0800\",\"remote_addr\": \"10.0.0.48\",\"referer\": \"-\",\"request\": \"GET /AAABBB HTTP/1.1\",\"status\": 404,\"bytes\": 153,\"agent\": \"curl/7.61.1\",\"x_forwarded\": \"-\",\"up_addr\": \"-\",\"up_host\": \"-\",\"up_resp_time\": \"-\",\"request_time\": \"0.000\" }","input":{"type":"log"},"fields":{"type":"nginx_access_log"},"host":{"os":{"platform":"centos","version":"8","family":"redhat","name":"CentOS Linux","kernel":"4.18.0-240.el8.x86_64","type":"linux"},"name":"nginx-node1","id":"67ce2cbf0a394ce69fb40183d6072db1","containerized":false,"ip":["10.0.0.48","fe80::20c:29ff:fee0:b2c7"],"mac":["00:0c:29:e0:b2:c7"],"hostname":"nginx-node1","architecture":"x86_64"},"agent":{"id":"d1685601-0f6e-452c-8b78-cca1fe83f5a3","name":"nginx-node1","type":"filebeat","version":"7.16.3","hostname":"nginx-node1","ephemeral_id":"c6b6c228-1643-42b9-a4fc-0f1c6289eeb6"}}


{"@timestamp":"2022-03-19T13:19:38.417Z","@metadata":{"beat":"filebeat","type":"_doc","version":"7.16.3"},"ecs":{"version":"1.12.0"},"host":{"id":"67ce2cbf0a394ce69fb40183d6072db1","containerized":false,"ip":["10.0.0.48","fe80::20c:29ff:fee0:b2c7"],"mac":["00:0c:29:e0:b2:c7"],"hostname":"nginx-node1","name":"nginx-node1","architecture":"x86_64","os":{"family":"redhat","name":"CentOS Linux","kernel":"4.18.0-240.el8.x86_64","type":"linux","platform":"centos","version":"8"}},"agent":{"type":"filebeat","version":"7.16.3","hostname":"nginx-node1","ephemeral_id":"c6b6c228-1643-42b9-a4fc-0f1c6289eeb6","id":"d1685601-0f6e-452c-8b78-cca1fe83f5a3","name":"nginx-node1"},"log":{"file":{"path":"/apps/nginx/logs/error.log"},"offset":4536},"message":"2022/03/19 21:19:29 [error] 20480#0: *33 open() \"/apps/nginx/html/AAABBB\" failed (2: No such file or directory), client: 10.0.0.48, server: localhost, request: \"GET /AAABBB HTTP/1.1\", host: \"10.0.0.48\"","input":{"type":"log"},"fields":{"type":"nginx_error_log"}}
转换成易读格式查看
- 可以看到access日志和error日志分别生成了一份
{
    "@timestamp": "2022-03-19T13:19:33.418Z",
    "@metadata": {
        "beat": "filebeat",
        "type": "_doc",
        "version": "7.16.3"
    },
    "ecs": {
        "version": "1.12.0"
    },
    "log": {
        "offset": 14311,
        "file": {
            "path": "/apps/nginx/logs/access.log"
        }
    },
    "message": "{\"@timestamp\": \"19/Mar/2022:21:19:29 +0800\",\"remote_addr\": \"10.0.0.48\",\"referer\": \"-\",\"request\": \"GET /AAABBB HTTP/1.1\",\"status\": 404,\"bytes\": 153,\"agent\": \"curl/7.61.1\",\"x_forwarded\": \"-\",\"up_addr\": \"-\",\"up_host\": \"-\",\"up_resp_time\": \"-\",\"request_time\": \"0.000\" }",
    "input": {
        "type": "log"
    },
    "fields": { #注意这里
        "type": "nginx_access_log" #这个值将在后续过滤时被引用
    },
    "host": {
        "os": {
            "platform": "centos",
            "version": "8",
            "family": "redhat",
            "name": "CentOS Linux",
            "kernel": "4.18.0-240.el8.x86_64",
            "type": "linux"
        },
        "name": "nginx-node1",
        "id": "67ce2cbf0a394ce69fb40183d6072db1",
        "containerized": false,
        "ip": [
            "10.0.0.48",
            "fe80::20c:29ff:fee0:b2c7"
        ],
        "mac": [
            "00:0c:29:e0:b2:c7"
        ],
        "hostname": "nginx-node1",
        "architecture": "x86_64"
    },
    "agent": {
        "id": "d1685601-0f6e-452c-8b78-cca1fe83f5a3",
        "name": "nginx-node1",
        "type": "filebeat",
        "version": "7.16.3",
        "hostname": "nginx-node1",
        "ephemeral_id": "c6b6c228-1643-42b9-a4fc-0f1c6289eeb6"
    }
}


----------------------------------------------------------------------------
{
    "@timestamp": "2022-03-19T13:19:38.417Z",
    "@metadata": {
        "beat": "filebeat",
        "type": "_doc",
        "version": "7.16.3"
    },
    "ecs": {
        "version": "1.12.0"
    },
    "host": {
        "id": "67ce2cbf0a394ce69fb40183d6072db1",
        "containerized": false,
        "ip": [
            "10.0.0.48",
            "fe80::20c:29ff:fee0:b2c7"
        ],
        "mac": [
            "00:0c:29:e0:b2:c7"
        ],
        "hostname": "nginx-node1",
        "name": "nginx-node1",
        "architecture": "x86_64",
        "os": {
            "family": "redhat",
            "name": "CentOS Linux",
            "kernel": "4.18.0-240.el8.x86_64",
            "type": "linux",
            "platform": "centos",
            "version": "8"
        }
    },
    "agent": {
        "type": "filebeat",
        "version": "7.16.3",
        "hostname": "nginx-node1",
        "ephemeral_id": "c6b6c228-1643-42b9-a4fc-0f1c6289eeb6",
        "id": "d1685601-0f6e-452c-8b78-cca1fe83f5a3",
        "name": "nginx-node1"
    },
    "log": {
        "file": {
            "path": "/apps/nginx/logs/error.log"
        },
        "offset": 4536
    },
    "message": "2022/03/19 21:19:29 [error] 20480#0: *33 open() \"/apps/nginx/html/AAABBB\" failed (2: No such file or directory), client: 10.0.0.48, server: localhost, request: \"GET /AAABBB HTTP/1.1\", host: \"10.0.0.48\"",
    "input": {
        "type": "log"
    },
    "fields": { #注意这里
        "type": "nginx_error_log"  #这个值将在后续过滤时被引用
    }
}
codec=json 转换前和转换后的区别
未加 codec=json 前
- message字段不能进行很好的解析
#logstash-server1配置
input {
  beats {
    port => 5044
  }
}

output {
  if [fields][type] == "nginx_access_log" {
    stdout { codec => rubydebug }
  }
}

---------------------------------------------------------------------------

#输出如下
{
         "input" => {
        "type" => "log"
    },
           "ecs" => {
        "version" => "1.12.0"
    },
        "fields" => {
        "type" => "nginx_access_log"
    },
           "log" => {
          "file" => {
            "path" => "/apps/nginx/logs/access.log"
        },
        "offset" => 3279
    },
          "tags" => [
        [0] "beats_input_codec_plain_applied"
    ],
    "@timestamp" => 2022-03-20T04:48:07.370Z,
      "@version" => "1",
         "agent" => {
            "hostname" => "nginx-node1",
                "name" => "nginx-node1",
             "version" => "7.16.3",
        "ephemeral_id" => "d6dda78e-59f5-4a77-b5c4-1ef7a52c64bd",
                  "id" => "d1685601-0f6e-452c-8b78-cca1fe83f5a3",
                "type" => "filebeat"
    },
       "message" => "{\"@timestamp\": \"20/Mar/2022:12:48:04 +0800\",\"remote_addr\": \"10.0.0.1\",\"referer\": \"-\",\"request\": \"GET / HTTP/1.1\",\"status\": 304,\"bytes\": 0,\"agent\": \"Mozilla/5.0 (Windows NT 10.0; Win64; x64) AppleWebKit/537.36 (KHTML, like Gecko) Chrome/96.0.4664.110 Safari/537.36\",\"x_forwarded\": \"-\",\"up_addr\": \"-\",\"up_host\": \"-\",\"up_resp_time\": \"-\",\"request_time\": \"0.000\" }",
          "host" => {
             "hostname" => "nginx-node1",
                 "name" => "nginx-node1",
         "architecture" => "x86_64",
                   "id" => "67ce2cbf0a394ce69fb40183d6072db1",
        "containerized" => false,
                   "ip" => [
            [0] "10.0.0.48",
            [1] "fe80::20c:29ff:fee0:b2c7"
        ],
                   "os" => {
            "platform" => "centos",
             "version" => "8",
                "name" => "CentOS Linux",
              "kernel" => "4.18.0-240.el8.x86_64",
              "family" => "redhat",
                "type" => "linux"
        },
                  "mac" => [
            [0] "00:0c:29:e0:b2:c7"
        ]
    }
}
加 codec=json 后
- 可以看到nginx的json记录被很好的解析了出来
#logstash-server1配置
input {
beats {
port => 5044
codec => json #添加json解析
}
}
output {
if [fields][type] == "nginx_access_log" {
stdout { codec => rubydebug }
}
}
#输出结果
{
"referer" => "-",
"bytes" => 0,
"@version" => "1",
"status" => 304,
"ecs" => {
"version" => "1.12.0"
},
"host" => {
"name" => "nginx-node1",
"id" => "67ce2cbf0a394ce69fb40183d6072db1",
"hostname" => "nginx-node1",
"ip" => [
[0] "10.0.0.48",
[1] "fe80::20c:29ff:fee0:b2c7"
],
"mac" => [
[0] "00:0c:29:e0:b2:c7"
],
"architecture" => "x86_64",
"containerized" => false,
"os" => {
"name" => "CentOS Linux",
"version" => "8",
"kernel" => "4.18.0-240.el8.x86_64",
"type" => "linux",
"platform" => "centos",
"family" => "redhat"
}
},
"request_time" => "0.000",
"up_addr" => "-",
"up_host" => "-",
"@timestamp" => 2022-03-20T05:05:37.573Z,
"remote_addr" => "10.0.0.1",
"request" => "GET / HTTP/1.1",
"x_forwarded" => "-",
"tags" => [
[0] "_timestampparsefailure",
[1] "beats_input_codec_json_applied"
],
"input" => {
"type" => "log"
},
"log" => {
"offset" => 3639,
"file" => {
"path" => "/apps/nginx/logs/access.log"
}
},
"up_resp_time" => "-",
"agent" => {
"id" => "d1685601-0f6e-452c-8b78-cca1fe83f5a3",
"name" => "nginx-node1",
"hostname" => "nginx-node1",
"version" => "7.16.3",
"type" => "filebeat",
"ephemeral_id" => "d6dda78e-59f5-4a77-b5c4-1ef7a52c64bd"
},
"fields" => {
"type" => "nginx_access_log"
},
"_@timestamp" => "20/Mar/2022:13:05:31 +0800"
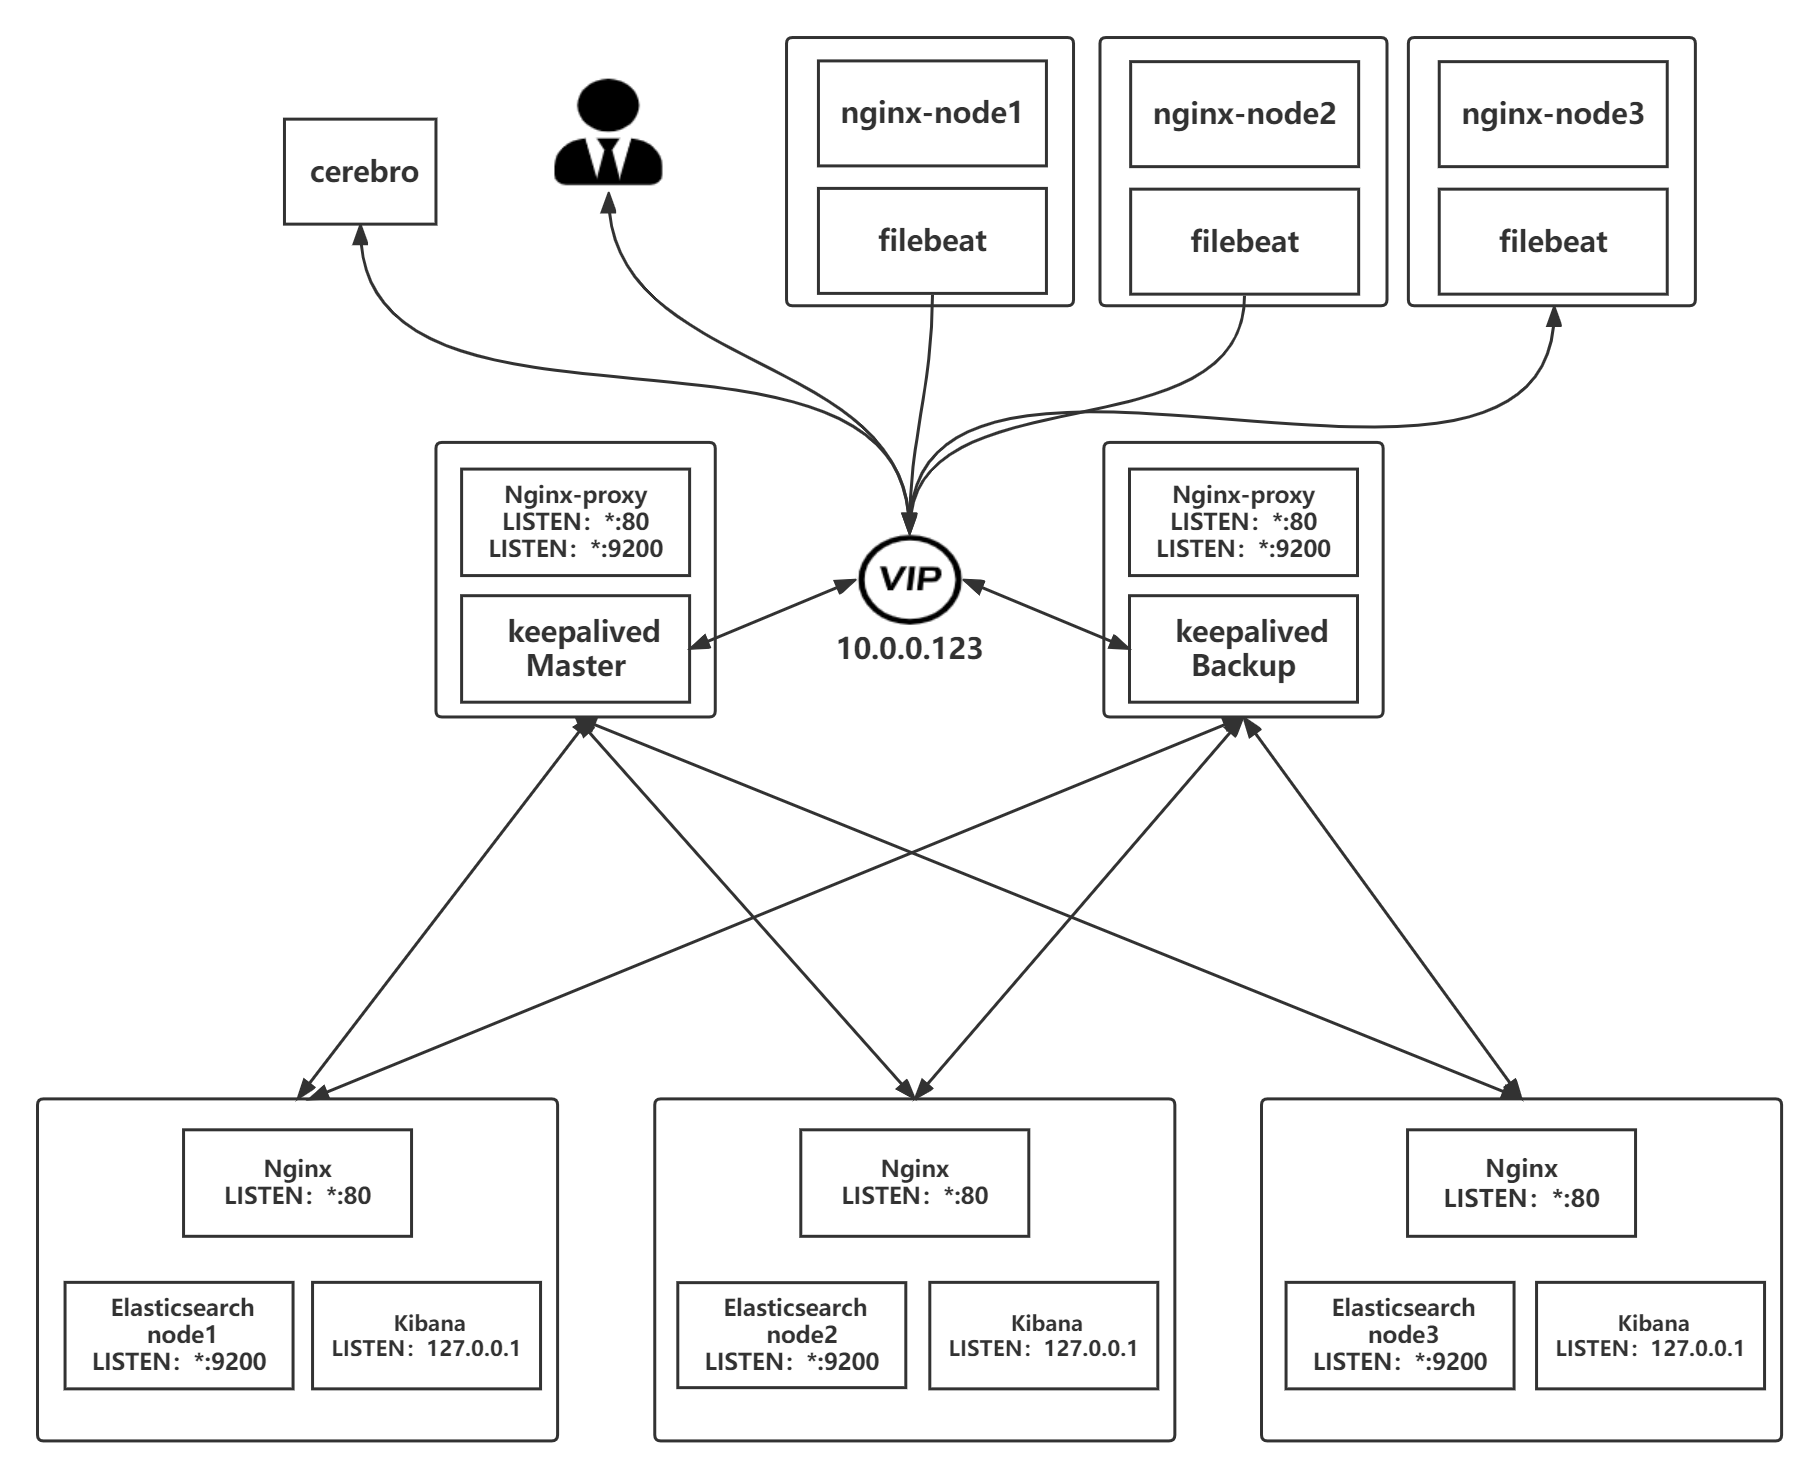
}-
Filebeat+nginx –> Elasticsearch –> kibana 实现日志采集
Filebeat 配置
…
总结
优点
- 配置简单,维护方便
缺点
- 日志本身如果是json格式将无法被解析
适用场景
- 对数据输出格式没有严格要求的情况下可以采用这种方式收集日志
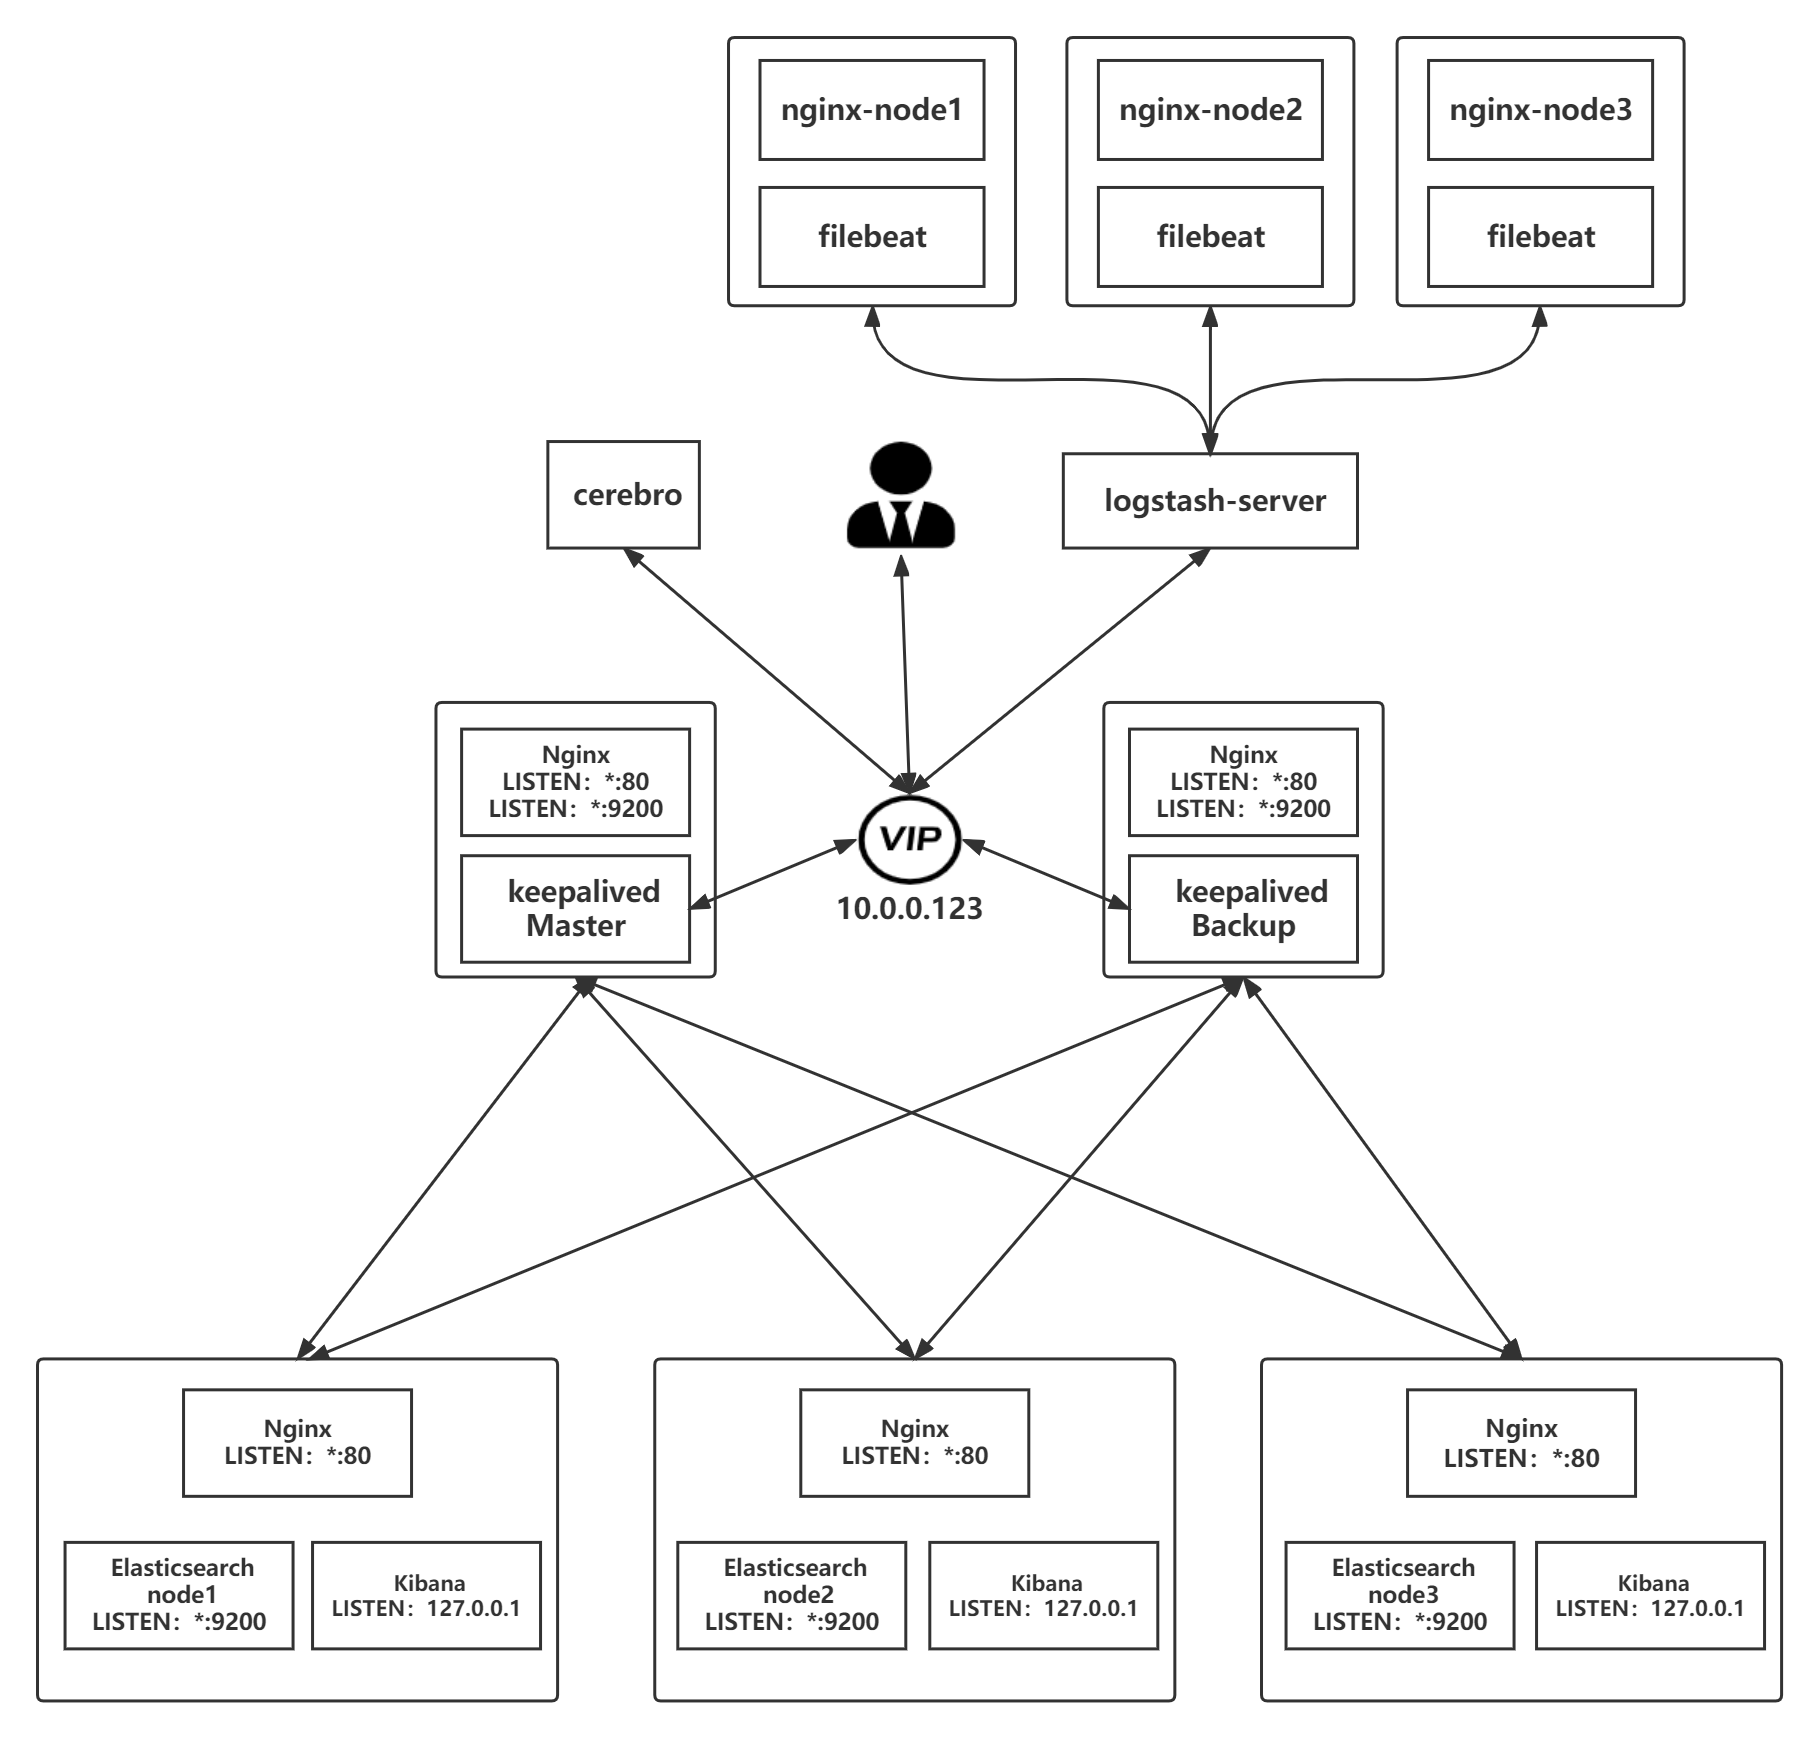
-
Filebeat+nginx –> Logstash –> Elasticsearch –> kibana 实现日志采集
filebeat 配置
[root@nginx-node1 ~]# vim /etc/filebeat/filebeat.yml

filebeat.inputs:
- type: log #指定文件类型
  enabled: true #是否开启,默认即开启,可不写
  paths:
    - /apps/nginx/logs/access.log #日志文件路径
  fields: #定义过滤字段
    type: nginx_access_log #过滤字段
- type: log
  enabled: true
  paths:
    - /apps/nginx/logs/error.log
  fields:
    type: nginx_error_log
- type: log
  enabled: true
  paths:
    - /var/log/messages
  fields:
    type: nginx_system_log
...
output.logstash: #输出到logstash
  hosts: ["10.0.0.38:5044"] #指定logstash的IP和开启的端口
...
logstash 配置
[root@logstash-server ~]# vim /etc/logstash/conf.d/to_es_log.conf
input {
  beats { #从beat插件输入
    port => 5044 #监听5044端口
    codec => json #输入文件转为json格式
  }
}

output {
    if [fields][type] == "nginx_access_log" { #过滤的字段
        elasticsearch { #输出到es
            hosts => ["10.0.0.123"] #指定es对应负载均衡的IP
            index => "app1-nginx-access-log-%{+YYYY.MM.dd}" #定义kibana中的索引
        }
    }
    if [fields][type] == "nginx_error_log" {
        elasticsearch {
            hosts => ["10.0.0.123"]
            index => "app1-nginx-error-log-%{+YYYY.MM.dd}"
        }
    }
    if [fields][type] == "nginx_system_log" {
        elasticsearch {
            hosts => ["10.0.0.123"]
            index => "app1-nginx-system-log-%{+YYYY.MM}" #系统日志每月更新一次索引
        }
    }
}
elasticsearch 配置
- 安装过程省略…
- 核心时将多台es做成集群,然后全部监听在本机的127.0.0.1的9200端口,在本机通过nginx代理的方式实现验证登录,防止恶意登录后删除索引信息等操作,然后加入到负载均衡,最后通过负载均衡来访问es集群
kibana 配置
定义索引
- Management –> stack management –> 索引模式
- 名称
- 如:
- app1-nginx-access-log*
- app1-nginx-error-log*
- app1-nginx_system-log*
- 如:
- 时间戳字段
- timestamp
- 创建索引模式
查看索引
- Discover
总结
优点
- 配置较为简单,维护方便
缺点
- 超大环境不适合,因为logstash易成为瓶颈,解决方法如:logstash写入 Kafka 或 redis
适用场景
- 生产中常用,一般场景都可以使用
注意事项
- 被收集的日志要转换成json格式才能更好的进行展示
- logstash要输入到elasticsearch时,要指向es的负载均衡,而非单一的es主机
- Filebeat 前面的 Logstash 注意添加 codec => json,才能实现对json文件的解析
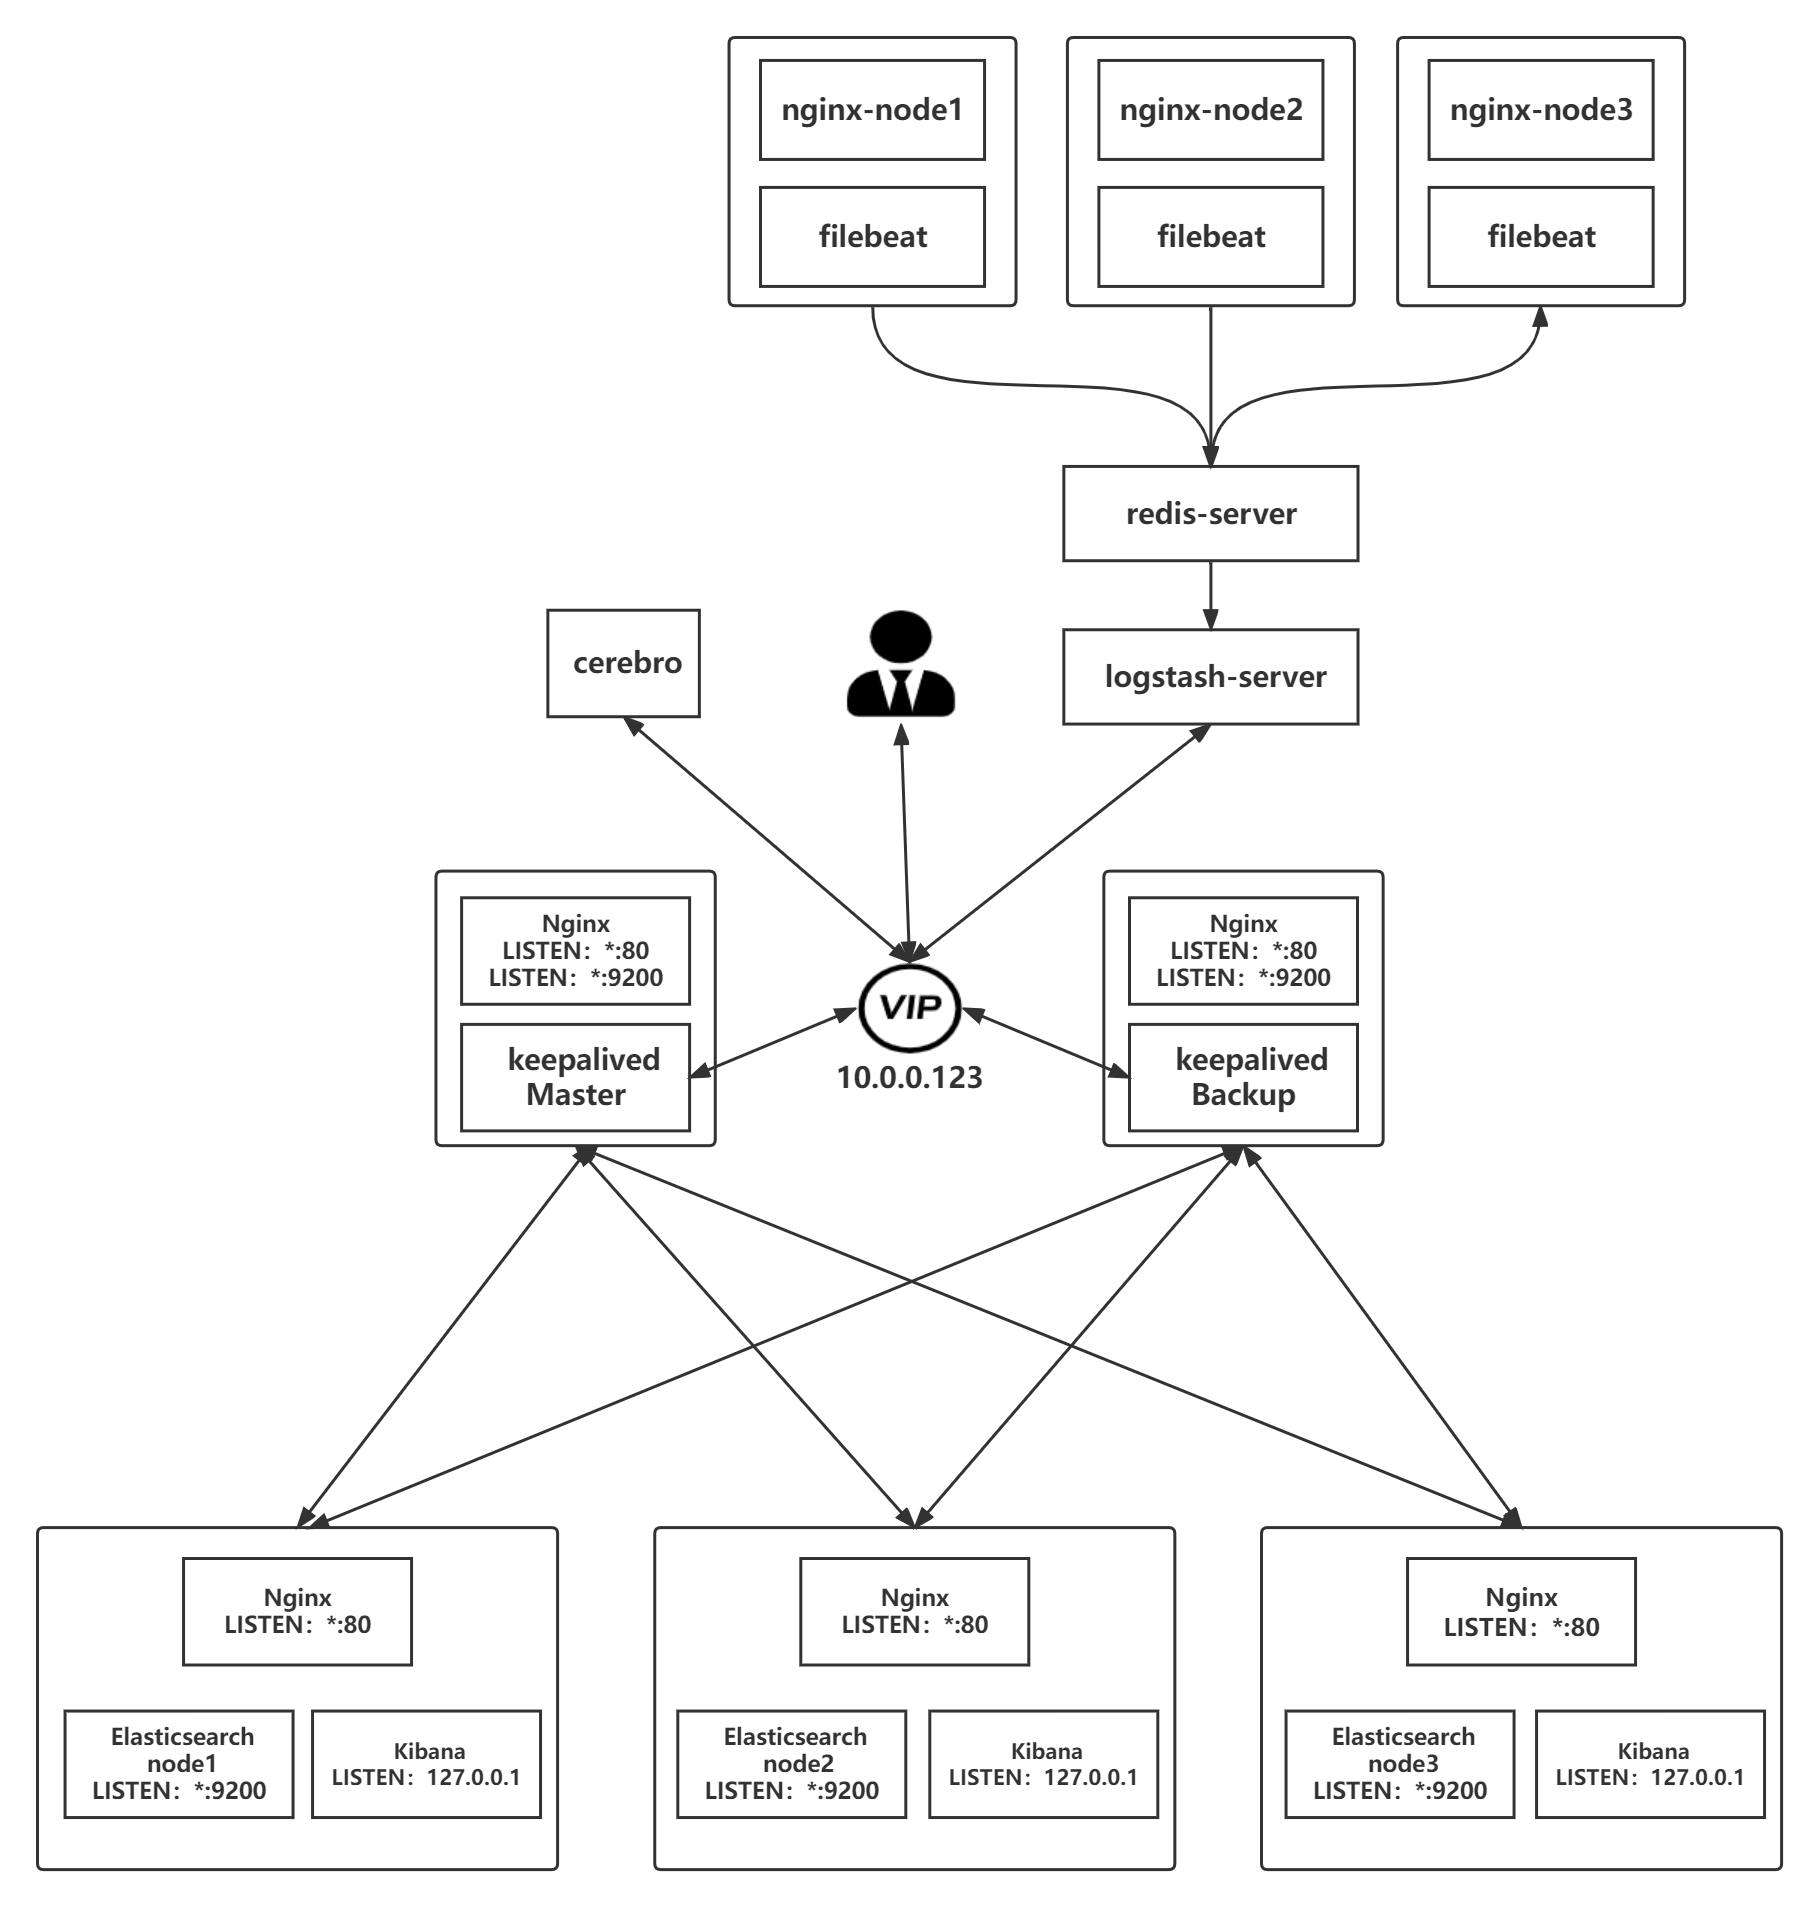
-
Filebeat+nginx –> Redis –> Logstash –> Elasticsearch –> kibana 实现日志采集
filebeat 配置
- 安装过程省略…
# /etc/filebeat/filebeat.yml

filebeat.inputs:
- type: log #指定输入文件类型
  enabled: true #是否开启,默认即开启,可不写
  paths:
    - /apps/nginx/logs/access.log #指定输入文件
  fields: #定义过滤字段
    type: nginx_access_log #过滤的字段
- type: log
  enabled: true
  paths:
    - /apps/nginx/logs/error.log
  fields:
    type: nginx_error_log
- type: log
  enabled: true
  paths:
    - /var/log/messages
  fields:
    type: nginx_system_log
...
output.redis: #输出到redis
  hosts: ["10.0.0.28:6379"] #指定redis主机的IP以及端口号
  password: "12345" #redis的密码
  key: "filebeat-nginx-log" #指定输入redis的key(主要这里区分不同节点)
  db: 1 #指定写入哪个redis的库
  timeout: 5
...
redis 配置
- 安装过程省略…
- 启动filebeat,然后向日志中追加数据查看redis中是否有数据的生成
[root@nginx-node1 ~]# systemctl start filebeat.service
[root@nginx-node1 ~]# echo "111" > /var/log/messages
[root@nginx-node1 ~]# echo "222" > /apps/nginx/logs/access.log
[root@nginx-node1 ~]# echo "333" > /apps/nginx/logs/error.log

---------------------------------------------------------------------------

[root@redis-server ~]# redis-cli
127.0.0.1:6379> AUTH 12345
OK
127.0.0.1:6379> SELECT 1
OK
127.0.0.1:6379[1]> KEYS *
1) "filebeat-nginx-log"
logstash 配置
- 安装过程省略
[root@logstash-server ~]# vim /etc/logstash/conf.d/filebeat_nginx_log.conf
input {
    redis {
        host => ["10.0.0.28"]
        port => "6379"
        password => "12345"
        db => "1"
        key => "filebeat-nginx-log" #引用redis中key的名称
        data_type => "list"
        codec => json
    }
}

output {
    if [fields][type] == "nginx_access_log" { #调用在filebeat定义的字段
        elasticsearch {
            hosts => ["10.0.0.123"]
            index => "app1-nginx-access-log-%{+YYYY.MM.dd}" #定义kibana中的索引
        }
    }
    if [fields][type] == "nginx_error_log" {
        elasticsearch {
            hosts => ["10.0.0.123"]
            index => "app1-nginx-error-log-%{+YYYY.MM.dd}"
        }
    }
    if [fields][type] == "nginx_system_log" {
        elasticsearch {
            hosts => ["10.0.0.123"]
            index => "app1-system-log-%{+YYYY.MM}" #系统日志每月更新一次索引
        }
    }
}- 启动logstash并观察redis中的数据是否被收集走
#logstash
[root@logstash-server ~]# systemctl start logstash.service


#redis
[root@redis-server ~]# redis-cli
127.0.0.1:6379> AUTH 12345
OK
127.0.0.1:6379> SELECT 1
OK
127.0.0.1:6379[1]> KEYS *
(empty list or set)
elasticsearch 配置
- 安装过程省略…
- 核心时将多台es做成集群,然后全部监听在本机的127.0.0.1的9200端口,在本机通过nginx代理的方式实现验证登录,防止恶意登录后删除索引信息等操作,然后加入到负载均衡,最后通过负载均衡来访问es集群
Kibana 配置
定义索引
- Management –> stack management –> 索引模式
- 名称
- 如:
- app1-nginx-access-log*
- app1-nginx-error-log*
- app1-nginx_system-log*
- 如:
- 时间戳字段
- timestamp
- 创建索引模式
查看索引
- Discover
总结
优点
- 因为使用了redis作为缓存,所以大大的减轻了logstash的压力,提高了性能
缺点
- 虽然filebeat可以通过定义fields字段的方式来进行日志分类采集,但是采集过来的数据即便是json格式的 但依旧不会被解析,因为日志原有的json格式被合并到filebeat自身的json格式中了
- **范例:**观察message字段
{
    "@timestamp": "2022-03-19T13:19:33.418Z",
    "@metadata": {
        "beat": "filebeat",
        "type": "_doc",
        "version": "7.16.3"
    },
    "ecs": {
        "version": "1.12.0"
    },
    "log": {
        "offset": 14311,
        "file": {
            "path": "/apps/nginx/logs/access.log"
        }
    },
    "message": "{\"@timestamp\": \"19/Mar/2022:21:19:29 +0800\",\"remote_addr\": \"10.0.0.48\",\"referer\": \"-\",\"request\": \"GET /AAABBB HTTP/1.1\",\"status\": 404,\"bytes\": 153,\"agent\": \"curl/7.61.1\",\"x_forwarded\": \"-\",\"up_addr\": \"-\",\"up_host\": \"-\",\"up_resp_time\": \"-\",\"request_time\": \"0.000\" }",
    "input": {
        "type": "log"
    },
    "fields": { #注意这里
        "type": "nginx_access_log" #这个值将在后续过滤时被引用
    },
    "host": {
        "os": {
            "platform": "centos",
            "version": "8",
            "family": "redhat",
            "name": "CentOS Linux",
            "kernel": "4.18.0-240.el8.x86_64",
            "type": "linux"
        },
        "name": "nginx-node1",
        "id": "67ce2cbf0a394ce69fb40183d6072db1",
        "containerized": false,
        "ip": [
            "10.0.0.48",
            "fe80::20c:29ff:fee0:b2c7"
        ],
        "mac": [
            "00:0c:29:e0:b2:c7"
        ],
        "hostname": "nginx-node1",
        "architecture": "x86_64"
    },
    "agent": {
        "id": "d1685601-0f6e-452c-8b78-cca1fe83f5a3",
        "name": "nginx-node1",
        "type": "filebeat",
        "version": "7.16.3",
        "hostname": "nginx-node1",
        "ephemeral_id": "c6b6c228-1643-42b9-a4fc-0f1c6289eeb6"
    }
}
适用场景
- 不常用,因为无法对json格式的日志进行很好的过滤
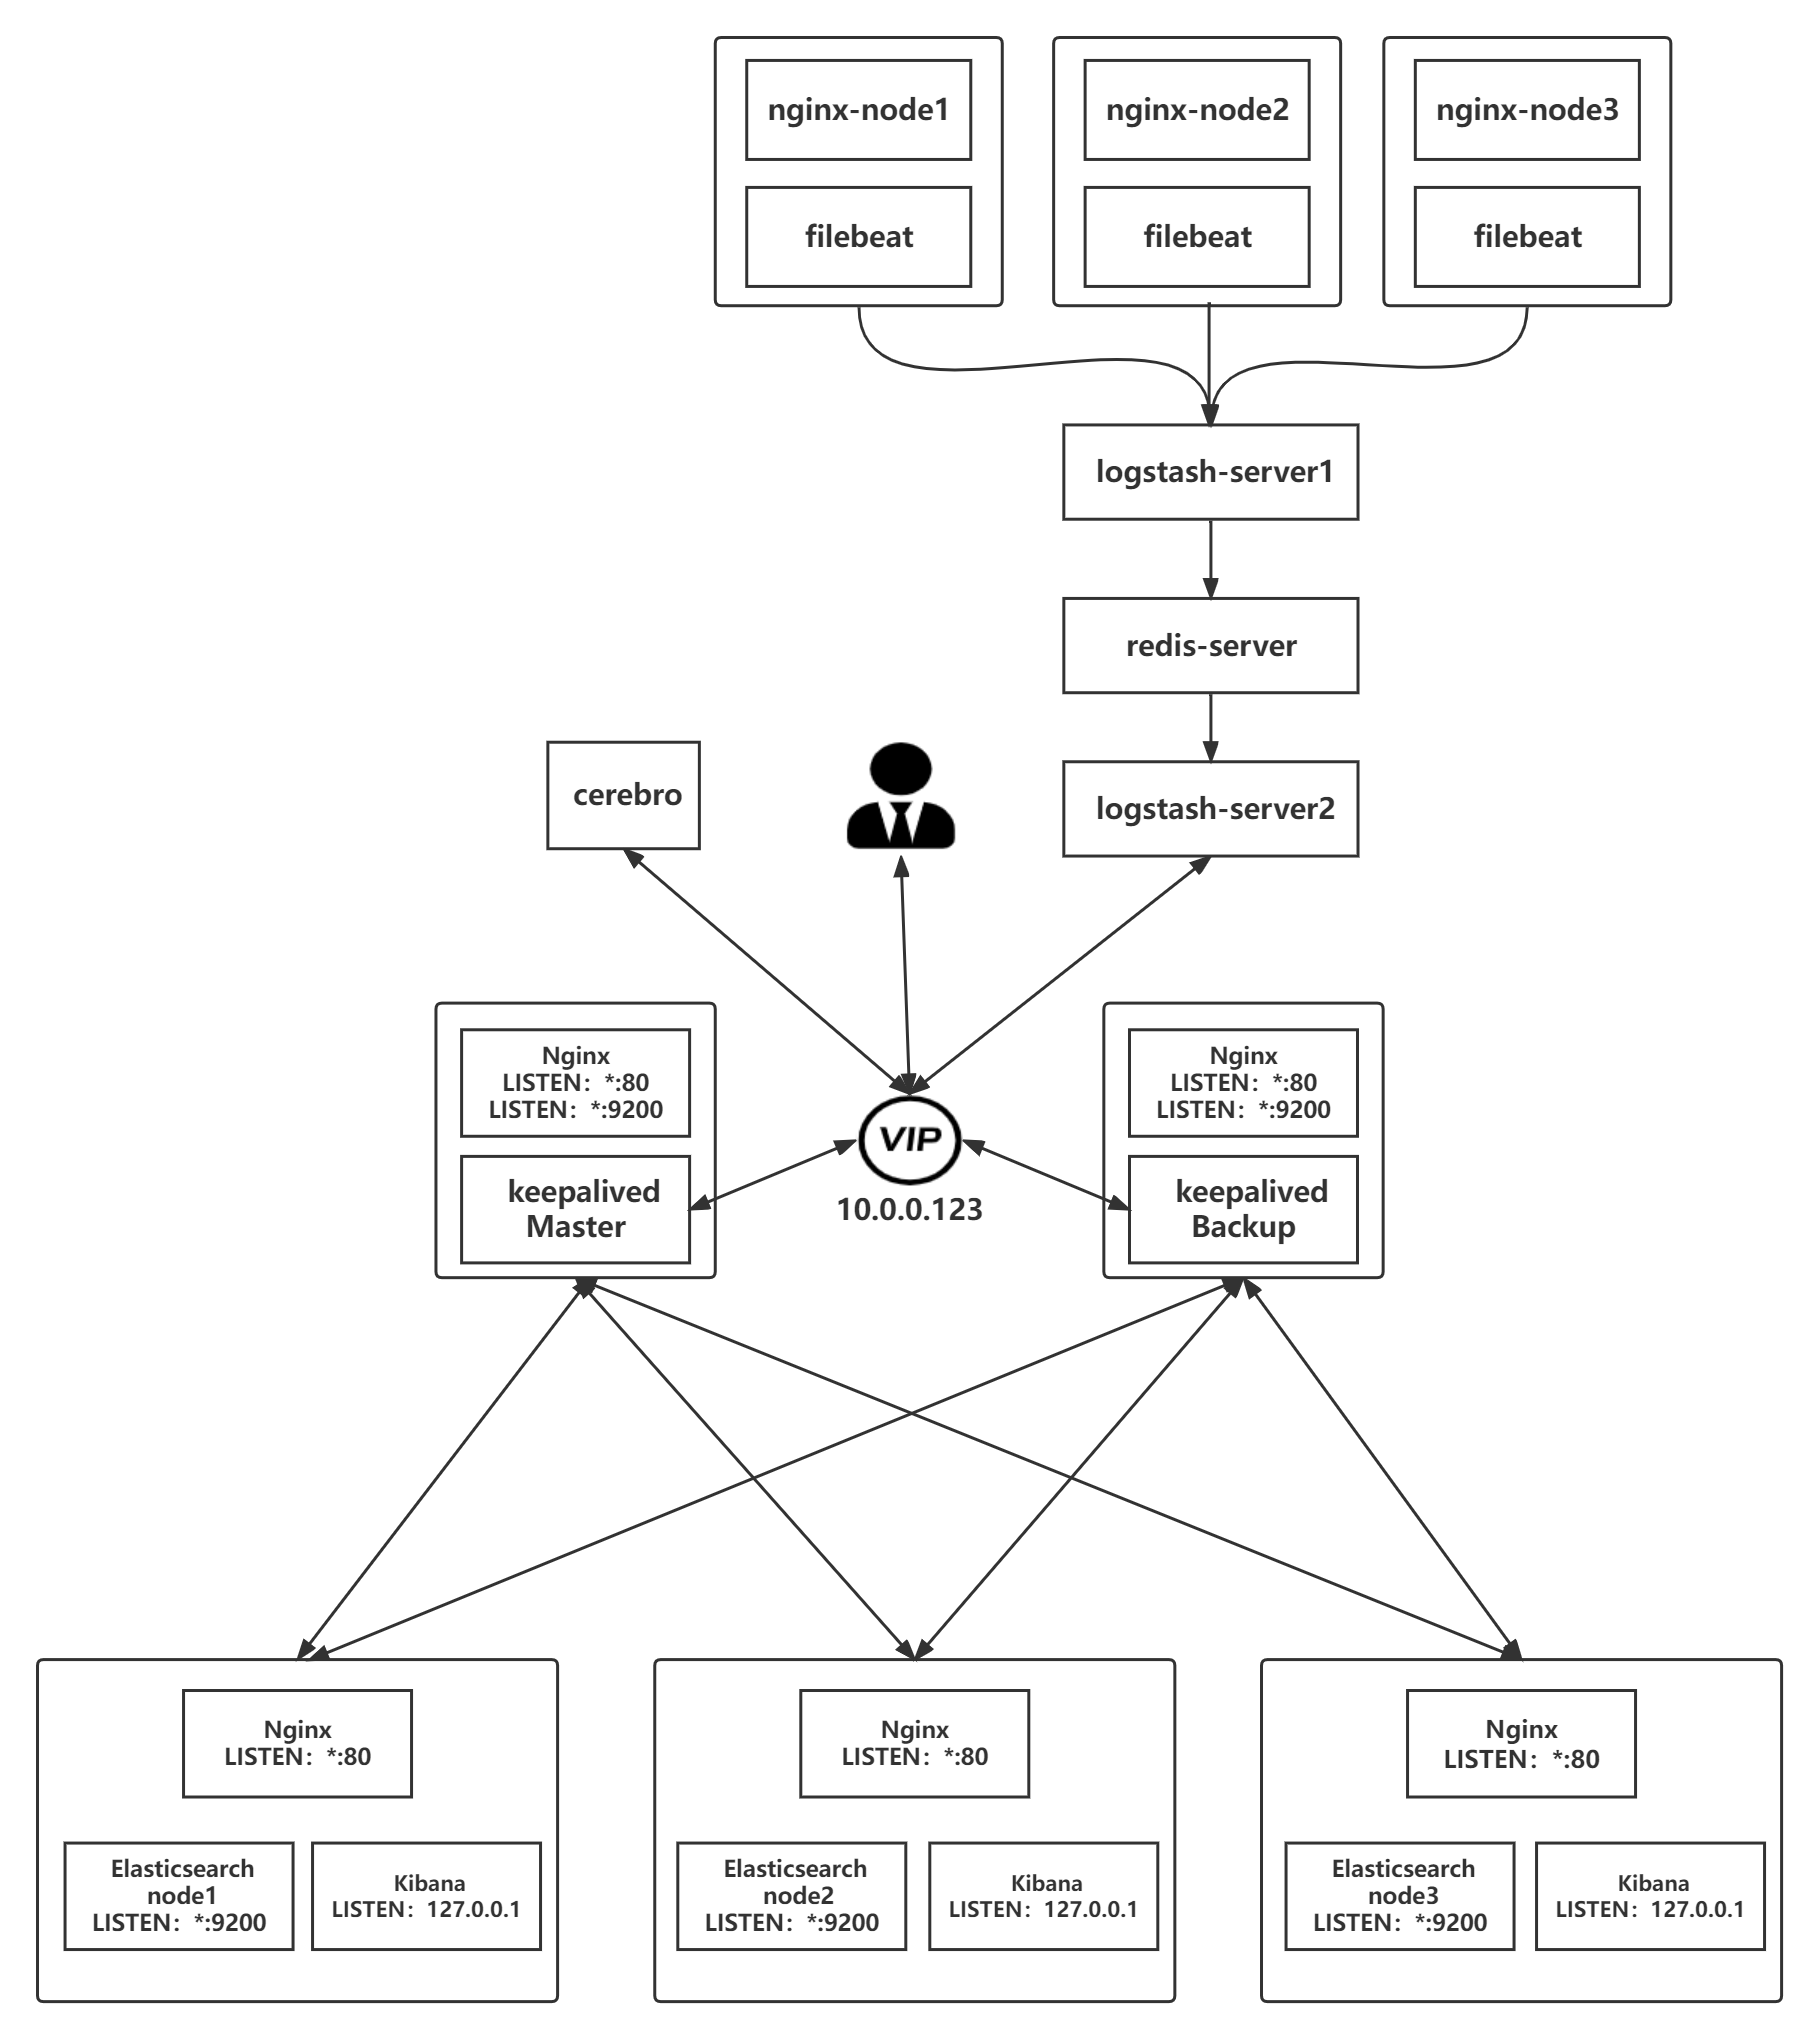
-
Filebeat+nginx –> Logstash –> Redis –> Logstash –> Elasticsearch –> kibana 实现日志采集
filebeat配置
[root@nginx-node1 ~]# vim /etc/filebeat/filebeat.yml
...
filebeat.inputs:
- type: log #文件类型
  enabled: true #是否启用
  paths:
    - /apps/nginx/logs/access.log #日志路径
  fields: #自定义字段
    type: nginx_access_log #自定义字段名称
- type: log
  enabled: true
  paths:
    - /apps/nginx/logs/error.log
  fields:
    type: nginx_error_log
- type: log
  enabled: true
  paths:
    - /var/log/messages
  fields:
    type: nginx_system_log

...
output.logstash:
  hosts: ["10.0.0.38:5044"] #指向logstash
...
logstash-server1 配置
[root@logstash-server1 ~]# vim /etc/logstash/conf.d/to_redis_nginx_log.conf
input {
  beats {
    port => 5044
    codec => json #输入转化为json格式
  }
}

output {
  if [fields][type] == "nginx_access_log" { #指定在filebeat中定义的fields类型
    redis {
        host => ["10.0.0.28"]
        port => "6379"
        password => "12345"
        db => "1" #写入到指定的数据库
        key => "nginx-access-log" #定义不同的key写入redis
        data_type => "list"
    }
  }
  if [fields][type] == "nginx_error_log" {
    redis {
        host => ["10.0.0.28"]
        port => "6379"
        password => "12345"
        db => "1"
        key => "nginx-error-log"
        data_type => "list"
    }
  }
  if [fields][type] == "nginx_system_log" {
    redis {
        host => ["10.0.0.28"]
        port => "6379"
        password => "12345"
        db => "1"
        key => "nginx-system-log"
        data_type => "list"
    }
  }
}
redis 配置
- 查看是否有key生成
127.0.0.1:6379[1]> KEYS *
1) "nginx-access-log"
2) "nginx-error-log"
3) "nginx-system-log"
logstash-server2 配置
- 将数据写入es
[root@logstash-server2 ~]# vim /etc/logstash/conf.d/redis_to_es_nginx_log.conf
input {
    redis {
        host => ["10.0.0.28"]
        port => "6379"
        password => "12345"
        db => "1"
        key => "nginx-access-log"
        data_type => "list"
    }
    redis {
        host => ["10.0.0.28"]
        port => "6379"
        password => "12345"
        db => "1"
        key => "nginx-error-log"
        data_type => "list"
    }
    redis {
        host => ["10.0.0.28"]
        port => "6379"
        password => "12345"
        db => "1"
        key => "nginx-system-log"
        data_type => "list"
    }
}

output {
    if [fields][type] == "nginx_access_log" {
        elasticsearch {
            hosts => ["10.0.0.123"]
            index => "app1-nginx-access-log-%{+YYYY.MM.dd}"
        }
    }
    if [fields][type] == "nginx_error_log" {
        elasticsearch {
            hosts => ["10.0.0.123"]
            index => "app1-nginx-error-log-%{+YYYY.MM.dd}"
        }
    }
    if [fields][type] == "nginx_system_log" {
        elasticsearch {
            hosts => ["10.0.0.123"]
            index => "app1-nginx-system-log-%{+YYYY.MM}"
        }
    }
}
elasticsearch 配置
- 安装过程省略…
- 核心时将多台es做成集群,然后全部监听在本机的127.0.0.1的9200端口,在本机通过nginx代理的方式实现验证登录,防止恶意登录后删除索引信息等操作,然后加入到负载均衡,最后通过负载均衡来访问es集群
Kibana 配置
定义索引
- Management –> stack management –> 索引模式
- 名称
- 如:
- app1-nginx-access-log*
- app1-nginx-error-log*
- app1-nginx_system-log*
- 如:
- 时间戳字段
- timestamp
- 创建索引模式
查看索引
- Discover
总结
优点
- 性能和冗余性都非常优秀
缺点
- 配置复杂,占用服务器较多
适用场景
- 适合超大环境
注意事项
-
被收集的日志要转换成json格式才能更好的进行展示
-
logstash要输入到elasticsearch时,要指向es的负载均衡,而非单一的es主机
-
Filebeat 前面的 Logstash 注意添加 codec => json,才能实现对json文件的解析
-
Filebeat+nginx –> kafka –> Elasticsearch –> kibana 实现日志采集
kafka集群部署
- 略